First post in the new place, and it’s a funeral. Not the most inspiring start for a trading blog, I know)) But any other opening would be dishonest.
The discretionary years
In October 2013 I started a journal of pump & dump trading in US stocks. Six years followed: small caps, Level II, the tape, overnights, trade reviews written at 3 a.m. There were green streaks, there was “the hardest year of my life”, there was our own prop and somebody else’s.
One of our crowd’s favorite plays was Gap&Crap. A stock gaps up hard, you wait for it to deflate, you short it. Simple as a stool. In January 2015 I got burned on exactly that: tiny risk, “it’s going to Gap and Crap anyway”, so keep adding… It didn’t crap. One day erased everything I had made over seven green days in a row. Back then I blamed psychology: I got glued to one stock and traded for revenge. All true. What I never really asked was whether the idea itself had an edge.
I did get close. Also in 2015 we tried to count which gap size works best for Gap&Crap, and as I wrote later, even then it was clear the strategy wasn’t as sweet as people made it sound. In 2018 we counted NASDAQ pumps and got 1311 cases for 2003–2017. At the end of 2018 I wrote that intuitive trading is self-deception and started a series on “boring trading”.
Then in November 2019 I hung up the sign: “Game over = Freedom”. Don’t bother me about trading anymore.
What changed
I never lost interest in markets. What changed is how I treat my own ideas. “It works” used to mean “I feel like it works” plus a couple of nice screenshots. Now I want an idea to survive a serious attempt to kill it before I take it seriously.
That’s what our small research desk is for. The roles are split: one writes up hypotheses as cards, one runs backtests, a reviewer checks the work and issues verdicts, a dispatcher keeps the registry. Every idea gets a number. First in line, naturally, was an old acquaintance: H-001, Gap&Crap.
The rule, in words
Short a stock that gapped up strongly. Enter only after the move starts to crack intraday, on a breakdown. Stop above the high of day, exit at the close. One attempt per stock per day. I’m leaving out the exact thresholds on purpose: some variants of this idea are still being tested, and I don’t want to leak the answers to them.
Three terms before the numbers:
- R is a trade’s result in units of risk. Every trade risks a fixed $100, so +0.19 R means +$19 per trade on average. This is a backtest, not a real account.
- Held-out means years nobody touched while the rule was being built and checked. It’s the exam without a cheat sheet.
- A 95% confidence interval is the range where the “true” average plausibly sits, given how noisy the trades are. If it includes zero, you can’t tell the strategy apart from nothing.
2019–2024: looked good
2019–2024 produced 1360 trades. With baseline costs (commission, slippage, 1% for locates) the average was 0.1872 R, interval [0.1343; 0.2411], 63.75% winners, profit factor 1.81. Re-pricing costs from real quotes with 500 ms of execution delay brought the average down to 0.1232 R. Still positive.
The kill criteria were written down before the 2019–2024 run: if the result after costs isn’t above zero, or if it goes negative without the five best trades, the hypothesis is dead. On 2019–2024 neither fired under realistic cost assumptions.
Honestly, this is the moment you want to pop the champagne. Which is exactly why you don’t.
Where we tripped over ourselves
A burned window. We ran 2025–26 before the verdict was in, and calibrated costs on it too. So it’s no longer an exam: we’ve seen it. There was already a warning sign there, by the way: on 2025–26 the top five trades made up 106% of the total profit.
A card written after the fact. The H-001 card was written after 2019–2024 had already been looked at. It describes an existing strategy; it’s not a preregistration, and it says so. The only truly untouched years left were 2013–2018.
Garbage in the data. Reverse splits draw fake gaps, so the split filter had to be rebuilt. Warrants slipped through a “common stock only” filter. And in one trade, after a trading halt, the quote feed carried a placeholder ask of 1000. The stop “filled” there and the backtest showed a fake loss of about $111k on a single trade. We added a price sanity filter afterwards. Had that error been in our favor, we might never have noticed. That scares me more than anything.
How many variants. The trading rule itself was never changed, but we tried different cost models, execution assumptions, latencies and sample filters. The earliest verdict says 1 variant. The registry said 13 at verdict time, the reviewer counted 18 (or 33 if you count every combination separately), and the registry now says 35. So somewhere between 18 and 35, depending on how you count. That matters: the more you look, the easier it is to see things that aren’t there.
The exam: 2013–2018
Before the run the reviewer froze everything: the rule, the primary metric, the costs and the failure criteria. The text was hashed, meaning it got a digital fingerprint so nobody could quietly edit it later. One run, no reruns, no tweaks. (A couple of launches crashed before any calculation because of a start-date bug; they produced no trades.)
The result:
- 230 trades, average 0.0118 R, interval [−0.1733; 0.1848]. Zero sits comfortably inside.
- Total +$272.24, but the five best trades made $1,483.79, which is 545% of the total. Without them: −$1,211.55.
- By year: 2013 −0.1680, 2014 −0.0249, 2015 −0.3627, 2016 +0.1448, 2017 +0.1398, 2018 +0.0278 R.
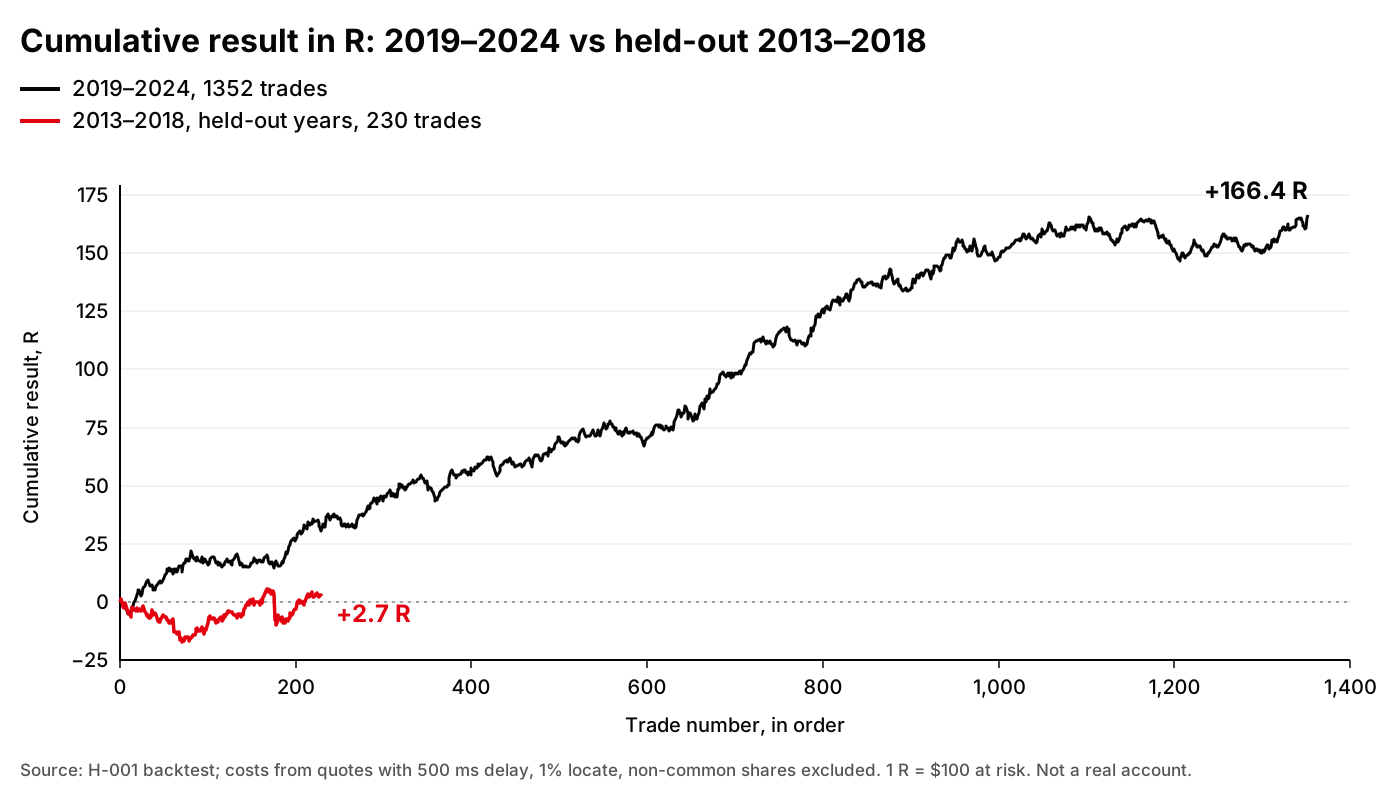
Cumulative R by trade: 2019–2024 (1,352 trades, 8 non-common shares excluded as in the primary metric) vs held-out 2013–2018 (230 trades).
Two of the four criteria fired: K2 (negative without the top five trades) and K4 (lower bound of the interval below zero while the average is under half of the 2019–2024 result). K1 (total not above zero) and K3 (average not above zero) didn’t fire, since technically there’s a tiny profit. But a profit that stands on five trades isn’t an edge. It’s a lottery ticket.
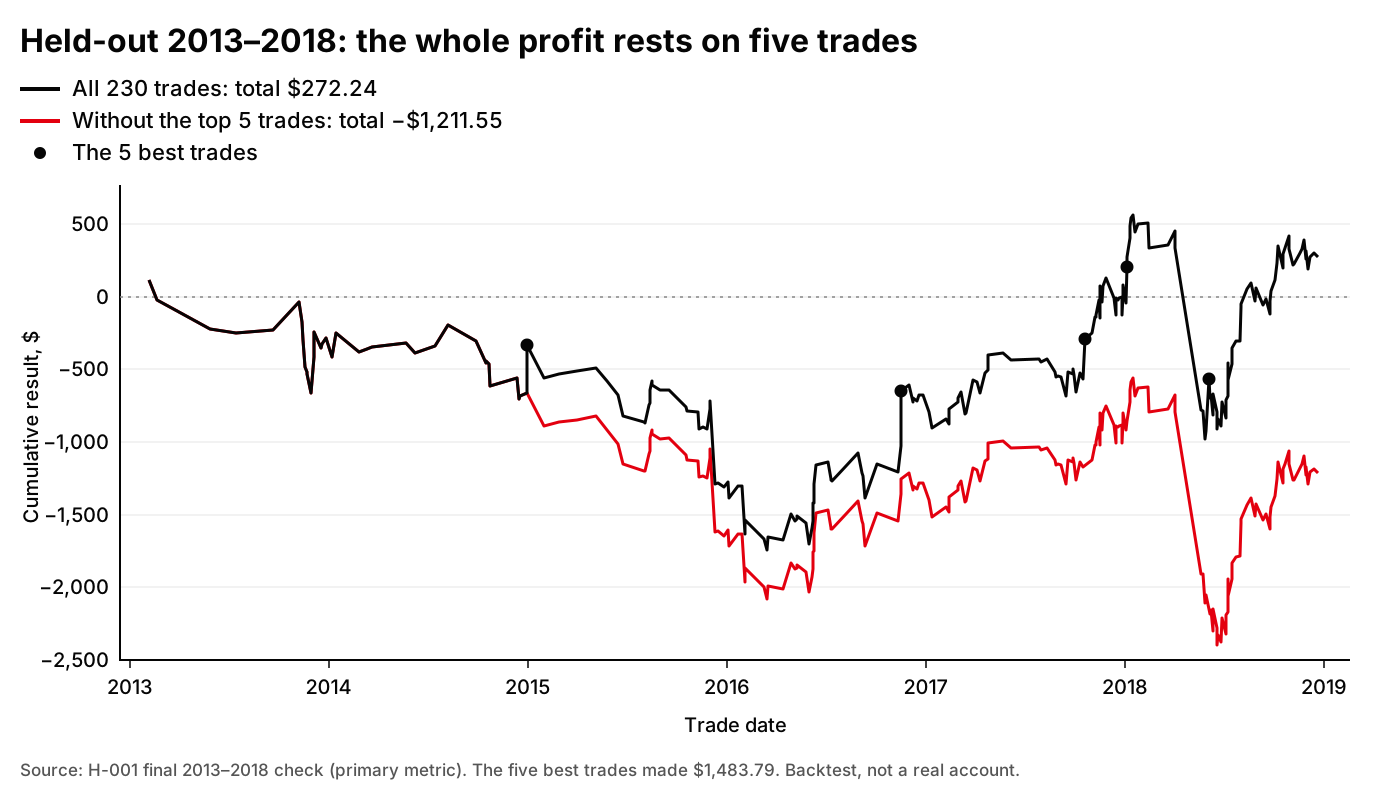
Held-out 2013–2018: $272.24 total with all trades, −$1,211.55 without the five best.
Verdict: dead. The edge found on 2019–2024 didn’t hold up on the untouched years. This doesn’t prove the strategy loses money on average, but it doesn’t confirm it makes any either. And that’s the generous reading: costs were carried over from 2025–26, and small-cap spreads in 2013–2018 were probably wider, so if anything the estimate is optimistic. For contrast, without the real-quote cost adjustment the same trades would have looked quite decent, around +0.15 R. The whole gap between “works” and “doesn’t work” is spread and latency. Trading by hand, I never once saw that.
The 2013–2018 window is now used up and can’t serve as a clean test again.
What I take from it
The 2015 me would probably have remembered a couple of juicy shorts and kept trading this setup. This time it took one hashed document and one run, and by the end of the night it was settled. Boring? Very. Deadly boring, as I once wrote. But cheaper than learning the same lesson with money.
Variants of this family are still being tested, H-003 for example. They’ll get their own cards, their own criteria and their own chance to die. I’ll write about all of them, the dead ones included. There will probably be more dead than alive. That’s fine. That’s the job.
“Game over” was about freedom from guessing. Looks like a new game starts now, one where you can lose honestly.
Sources
- H-001 verdict (current version, including the 2013–2018 final check)
- previous version of the H-001 verdict (2026-09-26)
- 2013–2018 run summary
- H-001 hypothesis card
- hypothesis registry
- https://speculari-fund.blogspot.com/2013/10/lets-pump-it-up-pump.html
- https://speculari-fund.blogspot.com/2015/01/trades-and-errors.html
- https://speculari-fund.blogspot.com/2018/06/Kak-najti-SVOJu-strategiju-Ili-skolko-bylo-pampov-v-proshlom.html
- https://speculari-fund.blogspot.com/2018/12/SPECULARI-skuchnyj-trejding-Vstuplenie.html
- https://speculari-fund.blogspot.com/2019/11/game-over-freedom.html