After two failed backtests in a row of my short-the-gap strategy, H-001 and H-007, I wanted to step back and ask a simpler question. Not “how do I short a gapper”, but “what actually happens to a gapper by the end of the day”. No entries, no stops, no rules. Just the market.
What we measured
We took daily bars from September 2003 to September 2026 and picked the days when a US small cap opened with a strong gap up from the previous session’s close. For each of those days we looked at three things: how far the price moved from the open to the close, how high it got above the open, and how low.
That gave 15,361 observations: 5,383 stocks across 4,546 trading sessions. An observation is one stock on one day, not a trade. Every day carries the same weight.
Cleaning the data took a while. Splits that draw fake gaps, conflicting split records, ETFs and other non-stocks, exchange test symbols: all of it was excluded and counted separately. The input was 49.8 million rows of daily bars. Another 1,013 days stayed out of the sample because their market cap is unknown. They behave similarly: median −9.3%, 67.5% closed below the open.
A newer version of this study (from here on just “the report”) with extra cleaning gave exactly the same headline numbers and added breakdowns: by gap size, by opening price, by market cap, and by how far the price moved during the day. All of it is below.
The main point: gappers fade more often than not
- Median open-to-close: −7.24%.
- 67.0% of days closed below the open.
- The mean, though, is only −3.55%.
Why is the mean half as harsh as the median? The tail. A quarter of the days closed worse than −18.4%, but 5% of days closed better than +39.9%. The worst day was −93.9%, the best +1,284.6%. A handful of rockets like that pull the mean up, even though the typical day is red.
The intraday range is huge too: on average the high was 23.4% above the open and the low 17.8% below it.
How it changed by year
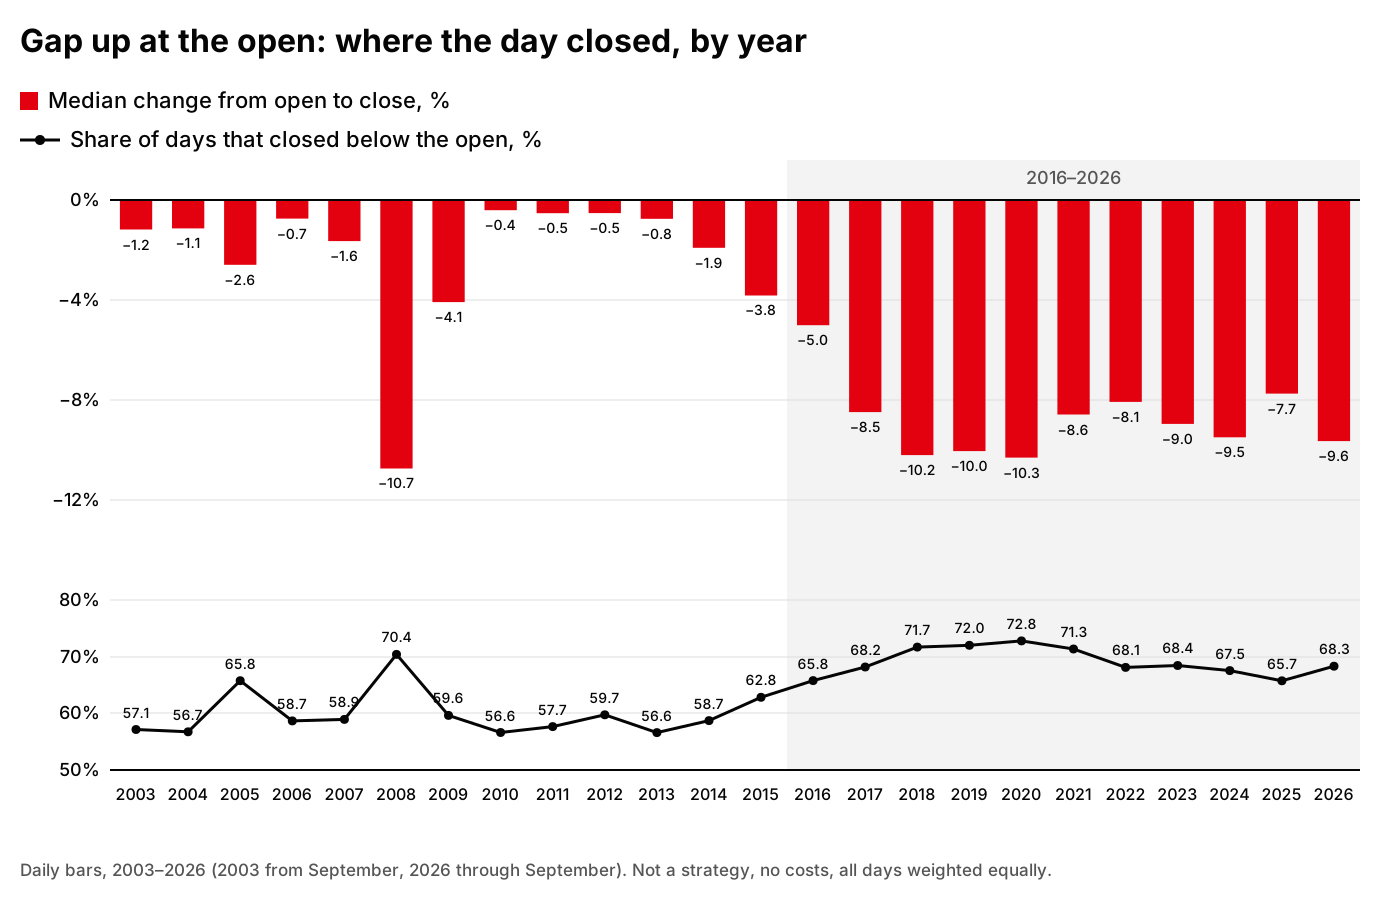
Daily bars, 2003–2026. Not a strategy, no costs, all days weighted equally.
The interesting part is not the overall number but how it moved over time.
From 2003 to 2014, leaving out the crisis years 2008–2009, the yearly median stayed close to zero: between −0.4% and −2.6%. Between 56.6% and 59.7% of days closed red, with 2005 the exception at 65.8%. Basically a slightly loaded coin.
2008 stands out: median −10.7%, 70.4% of days red. 2009 came in at −4.1%, and then it was back near zero.
Then a transition: 2015 at −3.8%, 2016 at −5.0%. From 2017 on the picture is different. Every year from 2017 to 2026 the median is between −7.7% and −10.3%, and 65.7–72.8% of days close red. Ten years in a row that look like 2008.
Why? I don’t know, and I won’t guess here. Traders always have plenty of explanations: more offerings, more retail, different market makers. This report tests none of them.
There is also an open question. As you’ll see below, the cheapest and smallest stocks fade the hardest. Maybe after 2016 there were simply more of them in the sample, and the shift is partly about the mix of stocks rather than how the market behaves. The report has no year-by-category split, so for now this is a question, not a finding.
Two more things changed. The first is the count. From 2004 to 2018 there were usually 196–498 observations a year, with 713 and 602 in the crisis years 2008–2009. In 2020 there were 1,602, in 2024 1,654, in 2025 1,868. 2020–2026 account for 9,559 of the 15,361, more than 60% of the whole sample.
The second is the range. In 2003 the average daily high was 13.0% above the open; in 2026 it was 32.4%. Over the same time the average low went from −8.5% to −21.5%. The top 5% of days in 2025 closed better than +51.7%. They fade more often, but they also fly further.
All the years in full:
| Year | Days | Median | Closed below open | Avg high | Avg low |
|---|---|---|---|---|---|
| 2003 | 63 | −1.2% | 57.1% | +13.0% | −8.5% |
| 2004 | 215 | −1.1% | 56.7% | +13.6% | −11.4% |
| 2005 | 222 | −2.6% | 65.8% | +10.1% | −10.7% |
| 2006 | 196 | −0.7% | 58.7% | +9.2% | −8.2% |
| 2007 | 224 | −1.6% | 58.9% | +12.5% | −10.9% |
| 2008 | 713 | −10.7% | 70.4% | +12.8% | −21.6% |
| 2009 | 602 | −4.1% | 59.6% | +19.3% | −14.8% |
| 2010 | 295 | −0.4% | 56.6% | +13.4% | −9.1% |
| 2011 | 248 | −0.5% | 57.7% | +9.5% | −10.5% |
| 2012 | 236 | −0.5% | 59.7% | +10.7% | −9.6% |
| 2013 | 235 | −0.8% | 56.6% | +14.6% | −9.2% |
| 2014 | 235 | −1.9% | 58.7% | +13.7% | −10.1% |
| 2015 | 347 | −3.8% | 62.8% | +18.9% | −12.4% |
| 2016 | 450 | −5.0% | 65.8% | +18.8% | −14.4% |
| 2017 | 462 | −8.5% | 68.2% | +18.3% | −15.3% |
| 2018 | 498 | −10.2% | 71.7% | +22.2% | −17.7% |
| 2019 | 561 | −10.0% | 72.0% | +22.6% | −18.3% |
| 2020 | 1,602 | −10.3% | 72.8% | +25.2% | −19.9% |
| 2021 | 904 | −8.6% | 71.3% | +22.6% | −17.1% |
| 2022 | 925 | −8.1% | 68.1% | +20.6% | −16.9% |
| 2023 | 1,236 | −9.0% | 68.4% | +27.1% | −20.0% |
| 2024 | 1,654 | −9.5% | 67.5% | +31.6% | −21.6% |
| 2025 | 1,868 | −7.7% | 65.7% | +29.6% | −20.6% |
| 2026 | 1,370 | −9.6% | 68.3% | +32.4% | −21.5% |
The bigger the gap, the deeper the fade
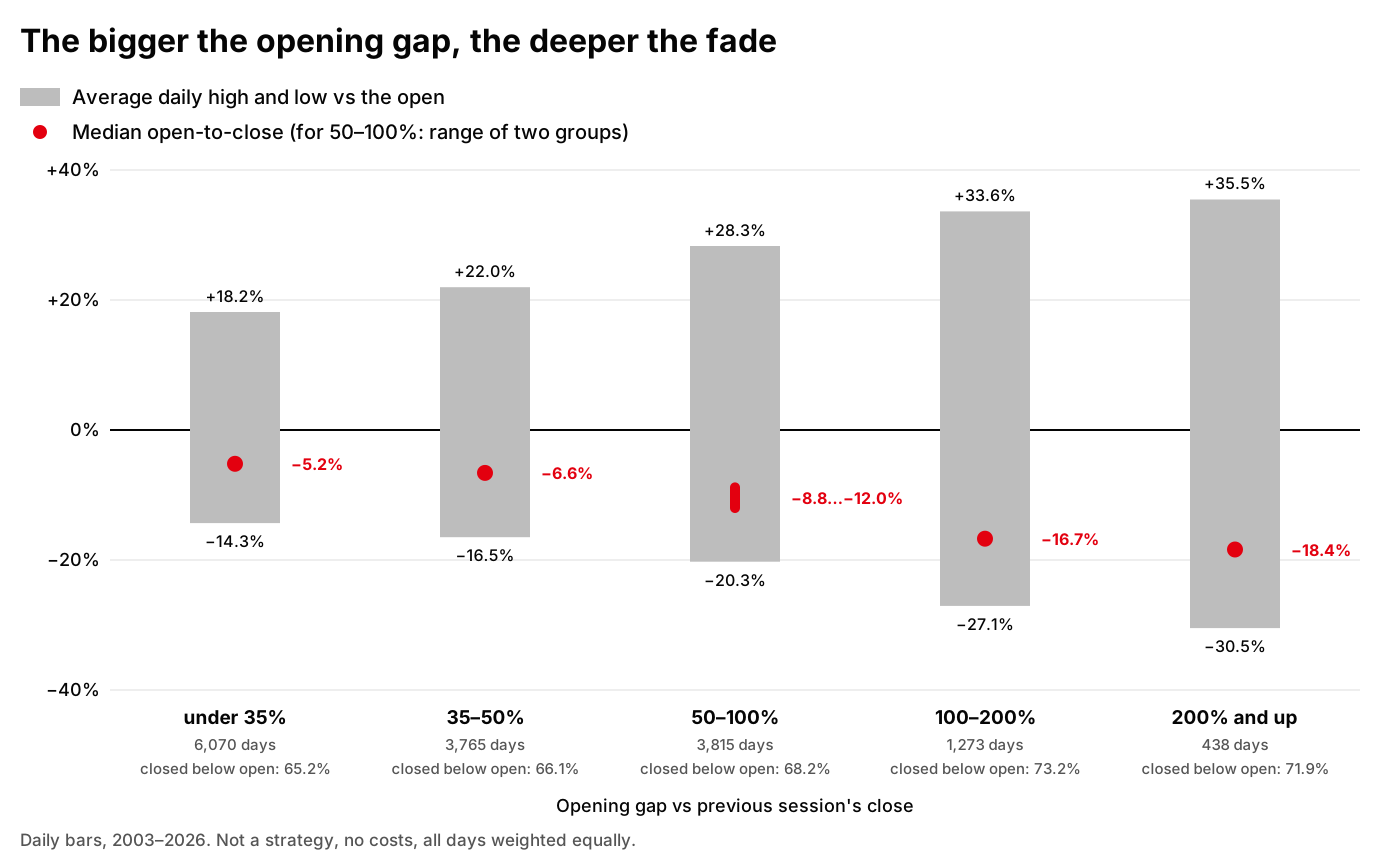
Daily bars, 2003–2026. Not a strategy, no costs, all days weighted equally.
The same days, split by the size of the opening gap:
| Gap | Days | Median | Closed below open | Avg high | Avg low | 5th percentile | 95th percentile |
|---|---|---|---|---|---|---|---|
| under 35% | 6,070 | −5.2% | 65.2% | +18.2% | −14.3% | −27.9% | +31.5% |
| 35–50% | 3,765 | −6.6% | 66.1% | +22.0% | −16.5% | −31.5% | +39.3% |
| 50–100% | 3,815 | −8.8…−12.0%* | 68.2% | +28.3% | −20.3% | — | — |
| 100–200% | 1,273 | −16.7% | 73.2% | +33.6% | −27.1% | −47.5% | +58.5% |
| 200% and up | 438 | −18.4% | 71.9% | +35.5% | −30.5% | −60.7% | +63.5% |
* The 50–100% row merges two groups from the report. The day counts are added up; the share closing below the open and the average high and low are recomputed weighted by the number of days. The median and percentiles of the merged group can’t be derived from the published figures, so the median is shown as the range of the two groups’ medians and the percentiles are left out. The 5th percentile means 5% of days closed worse than that value; the 95th means 5% closed better.
The pattern is simple: the harder a stock gaps up, the deeper it fades by the close on average. Under 35%, the median is −5.2% and 65.2% of days close below the open. At 100–200% it’s −16.7% and 73.2%; at 200% and up the median is −18.4%.
But the upside grows along with the downside. The average daily high rises from +18.2% to +35.5%, and the best 5% of days on the biggest gaps closed above +63.5%. A bigger gap means a bigger reward and a bigger risk.
The fade lives in the cheapest and smallest stocks
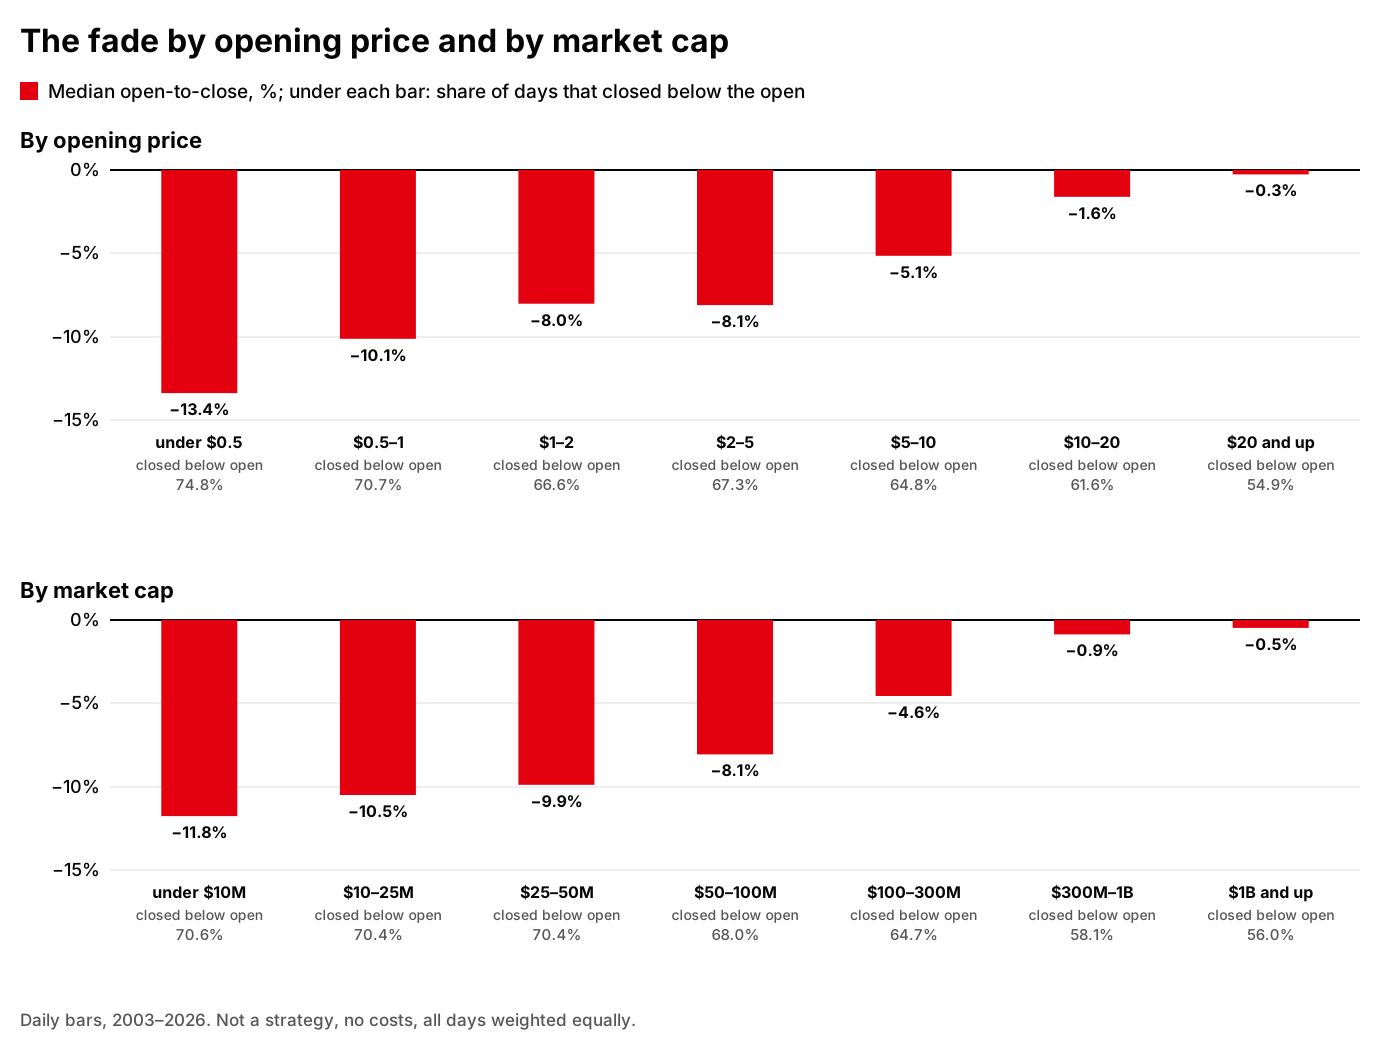
Daily bars, 2003–2026. Not a strategy, no costs, all days weighted equally.
By opening price:
| Opening price | Days | Median | Closed below open | Avg high | Avg low | 5th percentile | 95th percentile |
|---|---|---|---|---|---|---|---|
| under $0.5 | 2,219 | −13.4% | 74.8% | +25.6% | −22.8% | −38.4% | +44.8% |
| $0.5–1 | 1,732 | −10.1% | 70.7% | +25.9% | −20.3% | −37.2% | +49.6% |
| $1–2 | 2,502 | −8.0% | 66.6% | +27.3% | −18.5% | −35.3% | +45.8% |
| $2–5 | 3,988 | −8.1% | 67.3% | +25.6% | −18.0% | −36.1% | +40.3% |
| $5–10 | 2,469 | −5.1% | 64.8% | +20.4% | −16.2% | −37.0% | +34.9% |
| $10–20 | 1,655 | −1.6% | 61.6% | +16.5% | −13.3% | −35.5% | +24.8% |
| $20 and up | 796 | −0.3% | 54.9% | +11.3% | −10.1% | −29.2% | +18.9% |
By market cap:
| Market cap | Days | Median | Closed below open | Avg high | Avg low | 5th percentile | 95th percentile |
|---|---|---|---|---|---|---|---|
| under $10M | 3,303 | −11.8% | 70.6% | +35.0% | −22.6% | −41.8% | +61.1% |
| $10–25M | 2,814 | −10.5% | 70.4% | +28.6% | −20.6% | −37.4% | +50.2% |
| $25–50M | 2,144 | −9.9% | 70.4% | +24.1% | −19.4% | −36.7% | +44.5% |
| $50–100M | 2,008 | −8.1% | 68.0% | +21.1% | −17.2% | −35.0% | +37.2% |
| $100–300M | 2,434 | −4.6% | 64.7% | +17.0% | −15.0% | −33.6% | +31.5% |
| $300M–1B | 1,849 | −0.9% | 58.1% | +11.2% | −11.4% | −27.7% | +23.6% |
| $1B and up | 809 | −0.5% | 56.0% | +8.7% | −9.3% | −20.9% | +20.8% |
Here the picture is even sharper. Stocks under $0.5: median −13.4%, 74.8% closed below the open. $20 and up: −0.3% and 54.9%, close to a coin flip. Market cap shows the same thing: under $10M the median is −11.8% with 70.6% of days red; at $1B and up it’s −0.5% and 56.0%.
For anyone who wants to short this, that’s the main news. The strongest fade sits exactly where shorting is hardest. The cheapest and smallest stocks have the widest spreads, they’re the hardest to locate, and the locate costs more. The pretty median lives in precisely the corner of the market where costs eat the most.
How far the price moves during the day
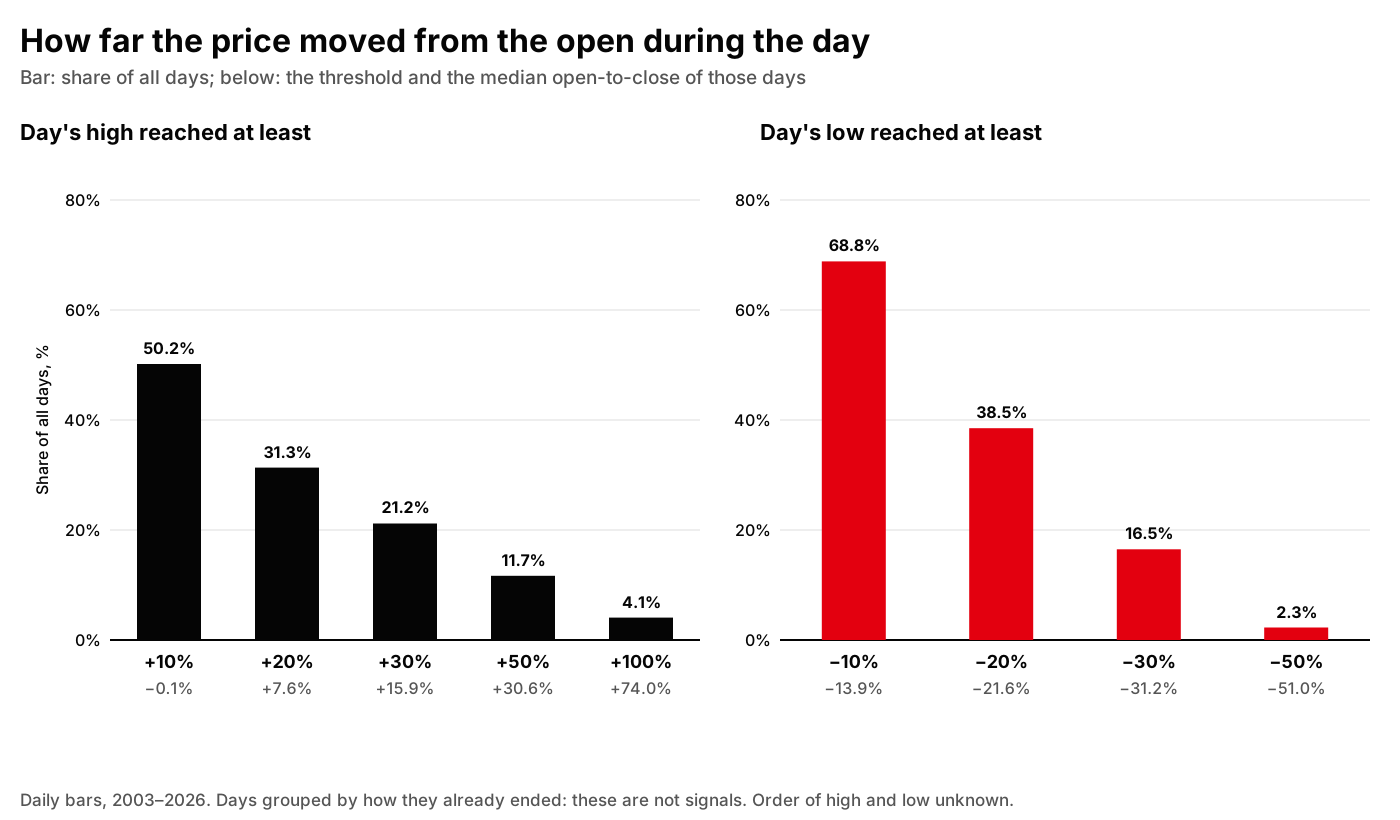
Daily bars, 2003–2026. Days grouped by how they already ended: these are not signals. Order of high and low unknown.
How many days moved at least a given distance up or down from the open at some point, and how they ended:
| Day’s high vs open | Days | Share of all days | Closed below open | Median open-to-close |
|---|---|---|---|---|
| +10% or more | 7,709 | 50.2% | 50.1% | −0.1% |
| +20% or more | 4,815 | 31.3% | 37.7% | +7.6% |
| +30% or more | 3,255 | 21.2% | 28.3% | +15.9% |
| +50% or more | 1,794 | 11.7% | 17.9% | +30.6% |
| +100% or more | 625 | 4.1% | 7.4% | +74.0% |
| Day’s low vs open | Days | Share of all days | Closed below open | Median open-to-close |
|---|---|---|---|---|
| −10% or lower | 10,575 | 68.8% | 84.6% | −13.9% |
| −20% or lower | 5,916 | 38.5% | 94.6% | −21.6% |
| −30% or lower | 2,534 | 16.5% | 97.2% | −31.2% |
| −50% or lower | 349 | 2.3% | 99.1% | −51.0% |
The top table is short-side risk in numbers. On half of all days the price got at least 10% above the open at some point; on 31.3% of days, at least 20%. On 4.1% of days, 625 of them, the stock doubled from the open at some point, and those days closed at a median +74.0%. A tight stop almost certainly gets hit on those days, and a short without a stop turns into a disaster.
The bottom table looks tempting: on 68.8% of days the price got at least 10% below the open at some point. But both tables are computed after the fact: days are grouped by how they already ended. They’re not signals. And the order is unknown: on the same day the price could first go +30% and then −20%, and the report won’t tell you which came first.
Why this is not a strategy yet
It’s very tempting to read a −7% median as “short gappers at the open and hold to the close”. I used to trade roughly like that by hand. But this report describes the market; it is not a backtest, and it is honest about what it can’t do:
- No costs. No commissions, no spread, no slippage. In small caps that is not a detail: in my H-001 backtest it was exactly spread and latency that separated “works” from “doesn’t”.
- No locate. The report doesn’t know whether you could borrow the stock at all, or at what price. For the hottest gappers the answer is often “no” or “expensive”.
- The close is not a fill. The closing price here only stands in for a market-on-close exit (MOC). A real exit can be worse.
- Look-ahead. Days were selected partly on full-day volume, which nobody knows at the open. So the sample contains days you couldn’t have picked the same way in the morning.
- Equal weight. Every day counts the same. A portfolio doesn’t work like that: you won’t have the money, risk budget or liquidity for every day.
- Unknown order. The day’s high and low are a range, not a path. The report doesn’t say what came first, the squeeze or the drop. For a short with a stop, that’s the whole question.
- The right tail kills shorts. A single +1,284.6% day costs a short almost thirteen times the position size. The median doesn’t notice that. The account does. And it isn’t rare: on 4.1% of all days the stock doubled from the open at some point.
And the main thing: I’ve already tested this on trades, and there is an answer. Gap&Crap, my strategy for shorting gap-ups, is exactly an attempt to harvest this fade with entry rules, a stop and costs. The first backtest, H-001, failed on 2013–2018, years I had set aside in advance and didn’t touch while choosing the rules: the edge found on 2019–2024 didn’t hold up there. The second, H-007, an attempt to enter later on a 30-minute bar, averaged −0.0312 R per trade over 545 trades (R is the amount I risk on one trade). I closed both as not working. The fade in the market is real; an edge after costs is something I haven’t found yet.
What I took from this
Context is not a signal. Knowing that gappers usually fade is useful. But everyone who has traded small caps knows it, and the market priced it in long ago: in spreads, in locate fees, in squeezes.
The median and the mean tell different stories. Median −7.24%, mean −3.55%. The gap between them is the tail that blows shorts out. Look only at the median and it’s easy to believe in money that isn’t there.
Markets change, and you only see it over a long history. 2003–2014 and 2017–2026 are effectively two different markets. Fitting a rule on one and trading it on the other is a trap. That’s why I split the test years in advance and don’t touch the set-aside years until the rules are fixed.
Sources
- the report of my study of gap-ups on daily data, 2003–2026 (updated version): overall summary, by-year breakdown, and breakdowns by gap size, opening price, market cap and intraday price moves; the summary and by-year figures are the same as in earlier versions
- the results of my H-001 backtest
- the results of my H-007 backtest